All published articles of this journal are available on ScienceDirect.

Characterizing Multivariate Regional Hubs for Schizophrenia Classification, Sex Differences, and Brain Age Estimation Using Explainable AI
Authors Info & Affiliations
Abstract
Introduction
Schizophrenia (SZ) affects 1% of the population and can cause behavioral dysfunctions. Personalized treatment options are lacking. Researchers developed AI models to classify and predict SZ using MRI and demographic data. The explainable AI approach identifies multivariate regional contributors, and patients with alterations in brain hubs should consider the risk of SZ and undergo further testing. This study aimed to investigate multivariate regional patterns for schizophrenia (SZ) classification, sex differences, and brain age by utilizing structural MRI, demographics, and explainable artificial intelligence (AI).
Methods
Various AI models were employed, and the outperforming model was identified for SZ classification, sex differences, and brain age predictions. For the SZ and sex classification tasks, support vector classifier (SVC), k-nearest neighbor (KNN), and deep learning neural network (DL) models were compared. In the case of regression-based brain age prediction, Lasso regression (LR), Ridge regression (RR), support vector regression (SVR), and DL models were compared. For each regression or classification task, the optimal model was further integrated with the Shapley additive explanations (SHAP), and significant multivariate brain regional patterns were identified.
Results
Our results demonstrated that the DL model outperformed other models in SZ classification, sex differences, and brain age predictions. We then integrated outperforming DL model with SHAP, and this integrated DL-SHAP model was used to identify the individualized multivariate regional patterns associated with each prediction. Using the DL-SHAP approach, we found that individuals with SZ had anatomical changes, particularly in the left pallidum, left posterior insula, left hippocampus, and left putamen regions, and such changes associated with SZ were different between female and male patients. Finally, we further applied the DL-SHAP method to brain age prediction and suggested important brain regions related to aging in health controls (HC) and SZ processes.
Discussion
The study analyzed the brain regions linked to Schizophrenia (SZ), revealing that the DL model outperformed other machine learning models in classification and regression-based predictions. The DL model was found to be more complex, capturing complex brain volumetric changes. The study also identified brain regions for sex classification, showing varying patterns in male and female patients. The study suggests that sex differences in SZ could be due to biological and environmental factors. However, the study has limitations, including modest sample size.
Conclusion
This study systematically utilized predictive modeling and novel explainable AI approaches and identified the complex multivariate brain regions involved with SZ classification, sex differences, and brain aging, thereby building a deeper understanding of neurobiological mechanisms involved in the disease, offering new insights into future SZ diagnosis and treatments, and laying the foundation for the development of precision medicine.
1. INTRODUCTION
Schizophrenia (SZ) is widely regarded as one of the most debilitating health conditions affecting humanity [1-6], with a lifetime prevalence of about 1% [7, 8]; it is known to affect 1 in 300 individuals [9]. Males and females are affected by the disease differently [10-12]. SZ causes severe behavioral dysfunctions, like hallucinations, delusions, and cognitive impairments, in individuals, and it can accelerate brain aging processes by introducing brain alterations [13-22]. In contrast to the significant personal and socioeconomic burden caused by SZ, it remains challenging to reach a comprehensive understanding [6]. Despite extensive research and clinical efforts, effective personalized treatment options for SZ are still lacking. Therefore, building a deeper understanding of SZ mechanisms, especially important multivariate brain regions associated with SZ, is crucial for improving diagnosis, developing more effective treatment strategies, and promoting precision medicine efforts.
Integrating magnetic resonance imaging (MRI) of the brain with machine learning/artificial intelligence (ML/AI) has dominated exploratory research lately [9, 15, 23-31] for SZ classification and age predictions. Existing studies have primarily focused on predictive modeling, but the underlying neurobiological regional patterns associated with such predictions are poorly understood yet. Prior research examining which brain regions are closely related to SZ has primarily used a univariate approach, neglecting the multivariate associations between regions. For example, a study [32] demonstrated a correlation between the left putamen volume and the delusion evaluation in SZ. However, evaluating the association between individual brain regions and SZ could be problematic, because this method ignored the influence of activities from other brain regions. Theoretically, putamen could have no impact on SZ, and/or the symptom could be due to alterations in other brain regions. Different brain regions work in a collaborative way and various regions have been implicated to be involved in SZ mechanisms [33-38]. Thus, it is critical to systematically investigate the associations between the brain regions and SZ mechanisms in a multivariate way, thereby uncovering the complex neurobiological mechanisms of this disorder. In this study, we proposed to evaluate the association between a brain region and SZ while accounting for the contributions of other regions. In this way, we can be more confident of the association identified between the target region and SZ progression.
This study sought to investigate the underlying multivariate regional patterns associated with neurobiological mechanisms, focusing on SZ vs. control classification, as well as male vs. female classification and brain age predictions in SZ using a large sample of MRI and demographic data. For this, we built various AI models for these predictions and integrated the outperforming model with the feature importance method to explain/interpret the predictions and identify the corresponding multivariate regional patterns. Since individuals with SZ have been reported to exhibit brain regional changes [23, 39-44], we hypothesized that our explainable AI approach can predict SZ vs. control classification and identify the multivariate regional contributors to such prediction. Since male vs. female disparity has been suggested in SZ [12, 45, 46], we hypothesized that our explainable AI-based modeling can characterize the neurostructural correlates in a multivariate fashion. Since some studies have suggested the effect of age on SZ [14, 47], we further tested this using our explainable AI approach. With the multivariate relationship between brain structure and SZ identified, our results could promote the understanding of the underlying mechanisms of SZ. Patients with obvious alterations in important brain hubs identified in our study should consider the risk of SZ and undergo further testing. In addition, a future direction of therapeutic intervention could be slowing down the alteration in the important brain hubs associated with SZ, as indicated by our results.
2. MATERIALS AND METHODS
2.1. Dataset
The dataset (N = 368, age: 18-66 years old; Table 1) was obtained from Schizconnect [48, 49] (www.schizconnect.org), with centralization provided by the Center for Biomedical Research Excellence (COBRE) [50], Neuromorphometry by Computer Algorithm Chicago (NMorphCH) [51], and function Biomedical Informatics Research Network (fBIRN) PhaseII__0010 [52]. We only included participants categorized as SZ strict and healthy controls and for whom brain T1-weighted MR images and age and sex information were available. Out of 368 subjects, 165 (42 females) subjects belonged to the SZ group and 203 (79 females) were healthy controls (HC). We utilized the brain T1-weighted MR images and extracted brain volumes corresponding to 145 anatomical regions of interest (ROIs) using the multi-atlas region segmentation utilizing ensembles of registration algorithms and parameters and locally optimal atlas selection (MUSE) [53]. These brain volumes were further corrected for the site and covariate effects using the harmonization technique [4, 54]. Using this harmonization approach, the sex and age effects were corrected for SZ classification, age effects were corrected for sex classification, and sex effects were corrected for brain age prediction. These harmonized brain regional volumes corresponding to 145 ROIs were utilized as inputs for the ML/DL models. The 145 ROIs included a wide range of tissue types, including gray matter, white matter, cerebrospinal fluid/ventricles, and brain stem.
| Dataset | Healthy Controls (HC) | Schizophrenia (SZ) Patients | Total | ||
|---|---|---|---|---|---|
| Male | Female | Male | Female | ||
| COBRE | 67 | 27 | 61 | 14 | 169 |
| NMorphCH | 21 | 22 | 30 | 13 | 86 |
| fBIRNPhase11 | 36 | 30 | 32 | 15 | 113 |
| Total | 124 | 79 | 123 | 42 | 368 |
2.2. SZ-related Classification and Regression Tasks and associated AI Models
We evaluated 3 SZ-related tasks, including two classification tasks and one regression task. The classification tasks included classifying SZ vs. HC and classifying male vs. female sex within the SZ group and HC group. We employed traditional ML models, including K-nearest neighbor (KNN) [36, 37] and support vector classifier (SVC) [38, 39], along with a deep learning neural networks (DL) model for classification tasks. The regression task estimated the brain age of SZ subjects. We employed traditional ML models, including Lasso regression (LR) [41, 42], Ridge regression (RR) [43, 44], and support vector regression (SVR) [55], as well as the DL model for the regression task.
The hyperparameters of traditional ML models were tuned with a grid search procedure, and the optimal hyperparameters were selected for each model and each classification or regression task. For KNN, the optimal number of neighbors was chosen from a range of 1-100 with an increment of 2. For SVC, the gamma value was chosen from -12 to -2 with an increment of 1. In addition, the Gaussian/radial basis function (RBF) kernel was employed, and we evaluated C values ranging from 0.2 to 2.6 with an increment of 0.2. For LR and RR, the optimal value for the alpha parameter was selected from the bounds 0.15-0.4 and 50-250, respectively. For SVR, an RBF kernel was employed, and the optimal values of gamma, epsilon, and c-values hyperparameters were selected from a range of -12 to -2 with an increment of 1, -7 to 3 with an increment of 1, and -5 to 4 with an increment of 1, respectively. To decide the optimal value, for each machine learning (ML) model, each hyperparameter was assigned a set of values, and all possible combinations were evaluated to identify the optimal configuration. The optimal performance was determined using the mean absolute error (MAE) loss function for the regression task and the log loss function for the classification task, with the lowest loss indicating the best-performing model.
We evaluated a DL model consisting of five dense hidden layers with a decreasing number of units in order of 200, 160, 120, 80, and 40 (Fig. 1). Each dense layer was followed by a rectified linear unit (ReLU) activation function, a batch normalization layer, and a dropout layer with a 0.1 dropout rate to stabilize the model and accelerate the training process [56, 57]. The final output layer comprised a single-unit dense layer accompanied by a linear activation function for the regression task and a sigmoid activation function for the classification task. This architecture was chosen as it yielded the lowest loss (MAE loss for the regression task and BCE loss for the classification task) for both regression and classification tasks.
To ensure the robustness of our models, a 10-fold stratified cross-validation (CV) strategy was implemented for classification tasks, and a 10-fold cross-validation (CV) strategy was implemented for the regression task, where data were split into training and test sets. The training set was further divided into training and validation sets, where the validation set accounted for 10% of the original training set, to monitor the training loss during the CV-based iterative training. CV is critically acclaimed for enhancing model generalization, mitigating overfitting, and providing a more robust estimation of the model’s performance on unseen data [58]. The outcomes reported here were obtained from the partitioned test set, which was not used in training the models. The traditional ML models were implemented in Python using the Python library Scikit-learn [59] and trained with the default settings. To train the DL model, the binary cross entropy (BCE) loss function was employed for classification, and the mean absolute error (MAE) loss function was utilized for regression tasks. After hyperparameter tuning, we selected 500 training epochs, 64 batch sizes, a 0.001 learning rate, and an ADAM optimizer. The results for the DL model were reported after running the model multiple times (i.e., five times here) and averaging the results over runs for robustness purposes. For classification, a soft voting approach was employed to get averaged outputs. The DL model was implemented using Python libraries TensorFlow [60] and Keras [61].
Various AI models were compared for each classification or regression task and the outperforming model (i.e., the DL model in our study) was integrated with the Shapley additive explanation (SHAP) [62], referred to as DL-SHAP model (Fig. 1), to explain or interpret the model outputs, thereby identifying the significant multivariate regional contributions to each classification or regression task. SHAP approach was utilized in this study because it is a state-of-the-art strategy for the interpretability or explainability of complex models and it satisfies all three essential properties, particularly local accuracy, missingness, and consistency, which are critical for the interpretability or explainability and the accuracy of complex AI models. SHAP comprises model-specific approximations, integrates the strengths of all other additive feature attribution methods, and outperforms other methods.
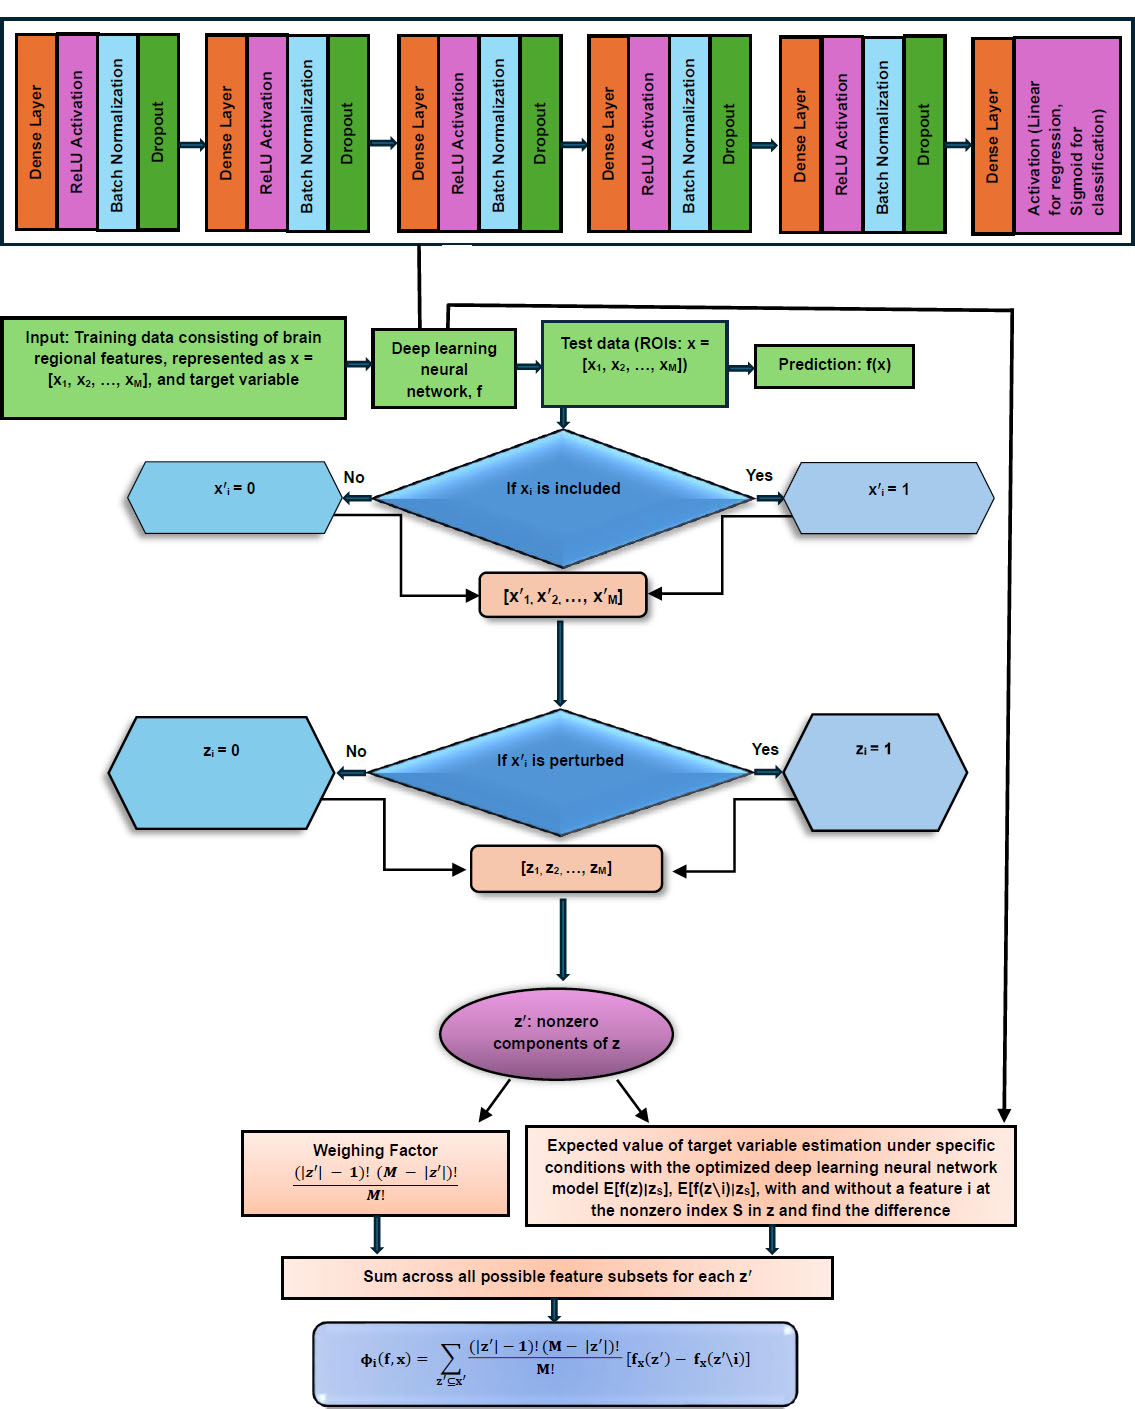
Schematic diagram of DL-SHAP.
This integration concept was originally proposed to investigate multivariate associations between brain regions and cognition in the context of Alzheimer's disease [63], and here, we intended to apply it to the schizophrenia domain. In DL-SHAP, the SHAP value for an input feature is computed by considering the contribution it makes to the final prediction of a participant. This contribution can be determined by observing the impact on the final output when the feature is added and when it is removed from the input. The SHAP value was calculated with the Python package SHAP. A higher absolute SHAP value indicates greater significance of the feature in obtaining the output. In our study, a higher absolute SHAP value associated with an ROI indicated a stronger association between that brain region and the related prediction of a participant. To aggregate the SHAP value across participants and evaluate the feature importance at the group level, we calculated the average absolute SHAP value over all participants, and regions with higher average absolute SHAP values over all participants within a group were believed to be important for the prediction results for that group of participants. It should be noted that the feature significance values with DL-SHAP across the models might vary as the contribution of the features to these models might change due to variations in architecture, weights, and the complexity of the model. Hence, the feature significance values with DL-SHAP are best used for understanding relative feature contributions within the same model, rather than for direct comparison across different models [62].
For assessing the classification model, we used micro-averaged accuracy, precision, recall, specificity, and F1-score as evaluation metrics. It is noteworthy that reporting multiple evaluation metrics can provide deeper insights into the models’ performance. For regression tasks, we computed the Spearman correlation between the actual and predicted brain age, and the related p-values were estimated to evaluate the model’s performance. Cohen’s d-effect sizes were computed from DL-SHAP values to examine group differences. Group-wise DL-SHAP regional features and DL-SHAP group differences in terms of Cohen’s d regional values were visualized using MRIcroGL [64]. Only ROIs with p-values less than 0.05, indicating statistical significance, were considered.
3. RESULTS
For the SZ vs. HC classification task, we found that the DL model outperformed (loss = 0.206, accuracy = 0.981, precision = 0.998, recall = 0.970, F1-score = 0.979, specificity = 0.990) all other traditional ML models in all evaluation metrics. The results of HC/SZ classification using various ML and DL models are listed in Table 2.
We then characterized the multivariate relationships between regional volumetric measures and HC/SZ classification using the DL-SHAP model. We identified the important brain regions for HC and SZ groups and their classification task. In the HC group, the top important regions were the left pallidum, left posterior insula, left hippocampus, fornix left, and left putamen, among others (Fig. 2a). In the SZ group, the top important regions identified were the left pallidum, left posterior insula, left hippocampus, right pallidum, and left putamen, among others (Fig. 2b). SHAP values at individual participant levels associated with the top important regions are visualized in Fig. (S1), which demonstrated the relationships between the volumetric measurements of individual ROI and SZ. For example, a larger pallidum was associated with a higher likelihood of being an SZ patient, and a smaller insula and hippocampus were associated with a higher likelihood of being an SZ patient. We then computed Cohen’s d between HC and SZ groups using DL-SHAP regional features and found a few regions (Fig. 2c) that were not key hubs in each group.
Sex classification was performed within the HC group and the SZ group, respectively. Our results indicated that the DL model outperformed (SZ group: loss = 0.188, accuracy = 0.994, precision = 0.992, recall = 1, F1-score = 0.996, specificity = 0.976; HC group: loss = 0.162, accuracy = 0.995, precision = 1.000, recall = 0.992, F1-score = 0.996, specificity = 1.000) all other traditional ML models corresponding to all evaluation metrics. The results of sex classification using various ML and DL models are listed in Tables 3 and 4. We further investigated the multivariate relationships between regional volumetric measures and sex classification. The top important regions identified for males in the HC group were the left temporal pole, right posterior insula, left ventral DC, left hippocampus, and left entorhinal area (Fig. 3a); for males in the SZ group, the top important regions identified were the left posterior cingulate gyrus, left cuneus, right posterior orbital gyrus, left inferior temporal gyrus, and right inferior temporal gyrus (Fig. 3b); for females in the HC group, the top important regions identified were the left temporal pole, left ventral DC, left entorhinal area, right posterior insula, and right occipital lobe white matter (Fig. 3c); and for females in the SZ group, the top important regions identified were left posterior cingulate gyrus, corpus callosum, left inferior temporal gyrus, fourth ventricle, and right posterior orbital gyrus (Fig. 3d). We compared sex differences within each HC and SZ group with Cohen’s d analysis (HC: Fig. 3e; SZ: Fig. 3f).
| Model | Accuracy | Precision | Recall | F1-score | Specificity | Loss |
|---|---|---|---|---|---|---|
| KNN | 0.601 | 0.615 | 0.291 | 0.395 | 0.852 | 13.810 |
| SVC | 0.652 | 0.653 | 0.479 | 0.552 | 0.793 | 11.526 |
| DL | 0.981 | 0.988 | 0.970 | 0.979 | 0.990 | 0.206 |
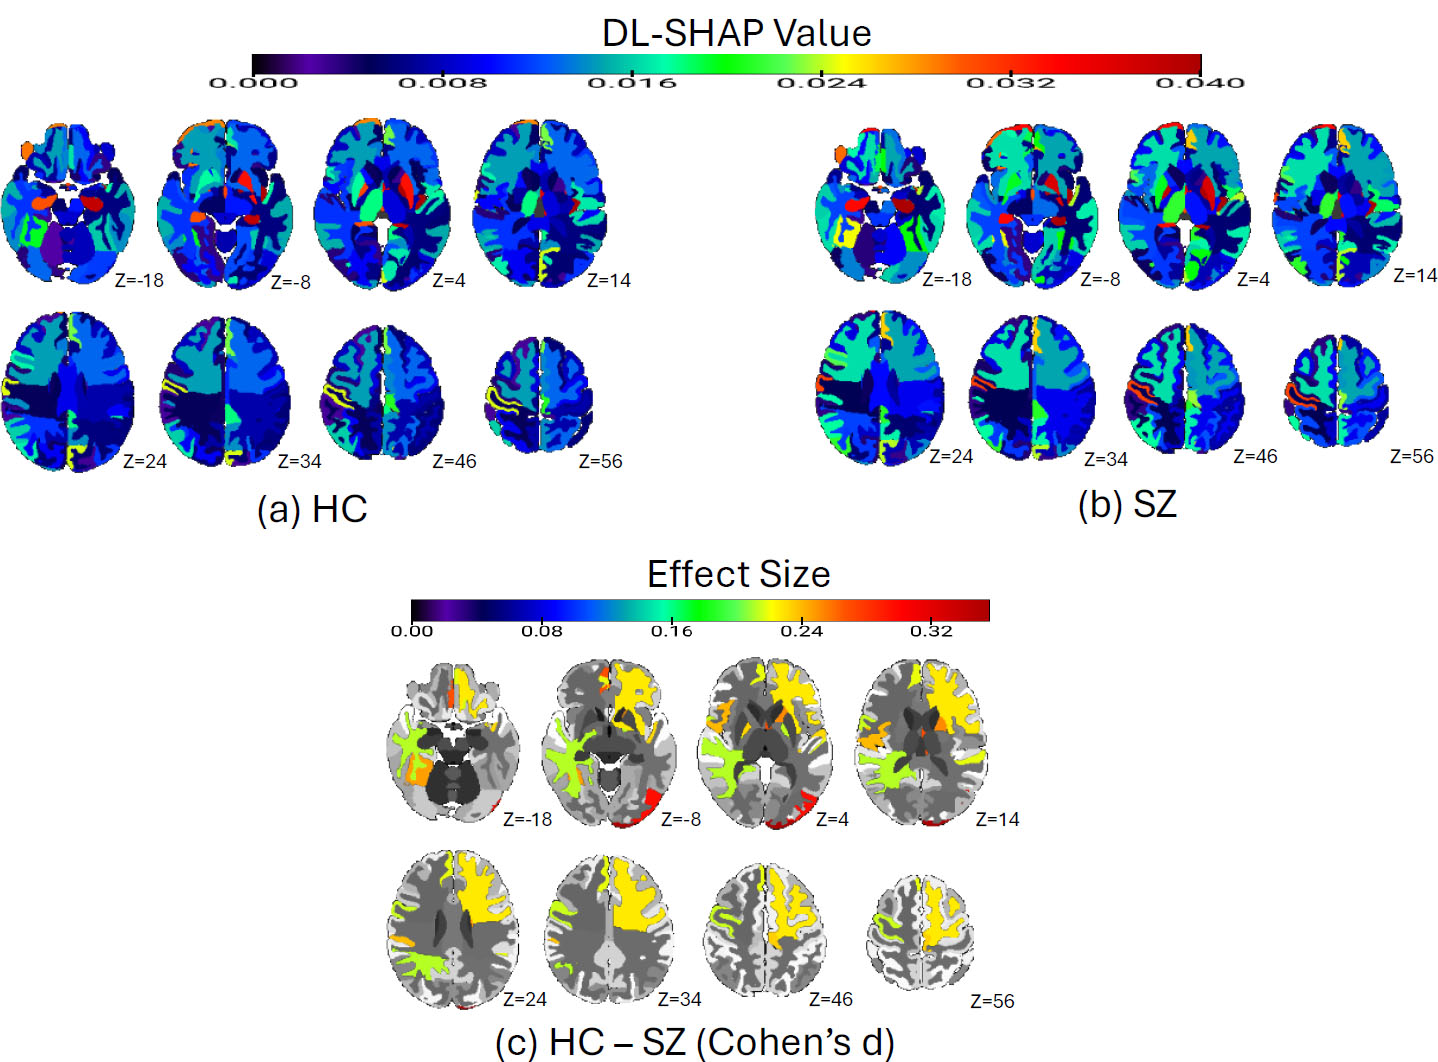
SZ vs. HC diagnosis classification via DL-SHAP. (a) Significant brain regions in the HC group. The average absolute SHAP values of each brain region in the HC population are plotted. The color bar represents the average absolute SHAP value. (b) Significant brain regions in the SZ group. The average absolute SHAP values of each brain region in the HC population are plotted. The color bar represents the average absolute SHAP value. (c) The Cohen’s d analysis comparing HC and SZ brains. We compared each ROI in HC and SZ brains by calculating the Cohen’s d using the SHAP value of each participant in two populations, and the absolute effect size is plotted. The color bar represents the absolute value of effect size.
| Model | Accuracy | Precision | Recall | F1-score | Specificity | Loss |
|---|---|---|---|---|---|---|
| KNN | 0.800 | 0.836 | 0.911 | 0.871 | 0.476 | 6.869 |
| SVC | 0.824 | 0.851 | 0.927 | 0.887 | 0.524 | 2.390 |
| DL | 0.994 | 0.992 | 1.000 | 0.996 | 0.976 | 0.188 |
| Model | Accuracy | Precision | Recall | F1-score | Specificity | Loss |
|---|---|---|---|---|---|---|
| KNN | 0.778 | 0.801 | 0.847 | 0.823 | 0.671 | 7.639 |
| SVC | 0.749 | 0.774 | 0.831 | 0.801 | 0.620 | 4.218 |
| DL | 0.995 | 1.000 | 0.992 | 0.996 | 1.000 | 0.162 |

Sex-wise classification within HC and SZ groups via DL-SHAP model. (a) Significant brain regions in males within the HC group for sex classification. The average absolute SHAP values of each brain region of male participants in the HC population are plotted. The color bar represents the average absolute SHAP value. (b) Significant brain regions in males for sex classification within the SZ group. The average absolute SHAP values of each brain region of male participants in the SZ population are plotted. The color bar represents the average absolute SHAP value. (c) Significant brain regions in females for sex classification within the HC group. The average absolute SHAP values of each brain region of female participants in the HC population are plotted. The color bar represents the average absolute SHAP value. (d) Significant brain regions in females within the SZ group. The average absolute SHAP values of each brain region of female participants in the SZ population are plotted. The color bar represents the average absolute SHAP value. (e) Cohen’s d analysis (absolute value) comparing male and female brains in the HC group. We compared each ROI in male and female brains in the HC group by calculating Cohen’s d using the SHAP value of each participant in two populations, and the absolute effect size is plotted. (f) Cohen’s d analysis (absolute value) comparing male and female brains in the SZ group. We compared each ROI in male and female brains in the SZ group by calculating Cohen’s d using the SHAP value of each participant in two populations, and the absolute effect size is plotted.
Finally, we found that the DL model outperformed all other traditional ML models in all evaluation metrics with a loss of 3.96 and a correlation of 0.92 (p = 7.9E-150) between the actual and predicted brain age (Fig. 4a). In contrast, the traditional ML models yielded a loss of around 7 and a correlation lower than 0.7. The results of brain age prediction using various ML and DL models are listed in Table 5. The multivariate relationships between the regional measures and brain age in SZ were also investigated using DL-SHAP. The top important regions identified for the HC group were the right superior frontal gyrus, left putamen, left supplementary motor cortex, right entorhinal area, and right subcallosal area, and the top important regions identified for the SZ group were the right superior frontal gyrus, left putamen, left pallidum, right subcallosal area, and right entorhinal area (Fig. 4b-d). Fig. (4b) shows the Cohen’s d effect size differences between HC and SZ groups using DL-SHAP regional features.
| Model | MAE Loss | Spearman’s Correlation | p-value |
|---|---|---|---|
| LR | 6.91 | 0.67 | 5.84E-49 |
| RR | 6.97 | 0.68 | 2.66E-50 |
| SVR | 7.53 | 0.60 | 1.03E-38 |
| DL | 3.97 | 0.92 | 7.9E-150 |
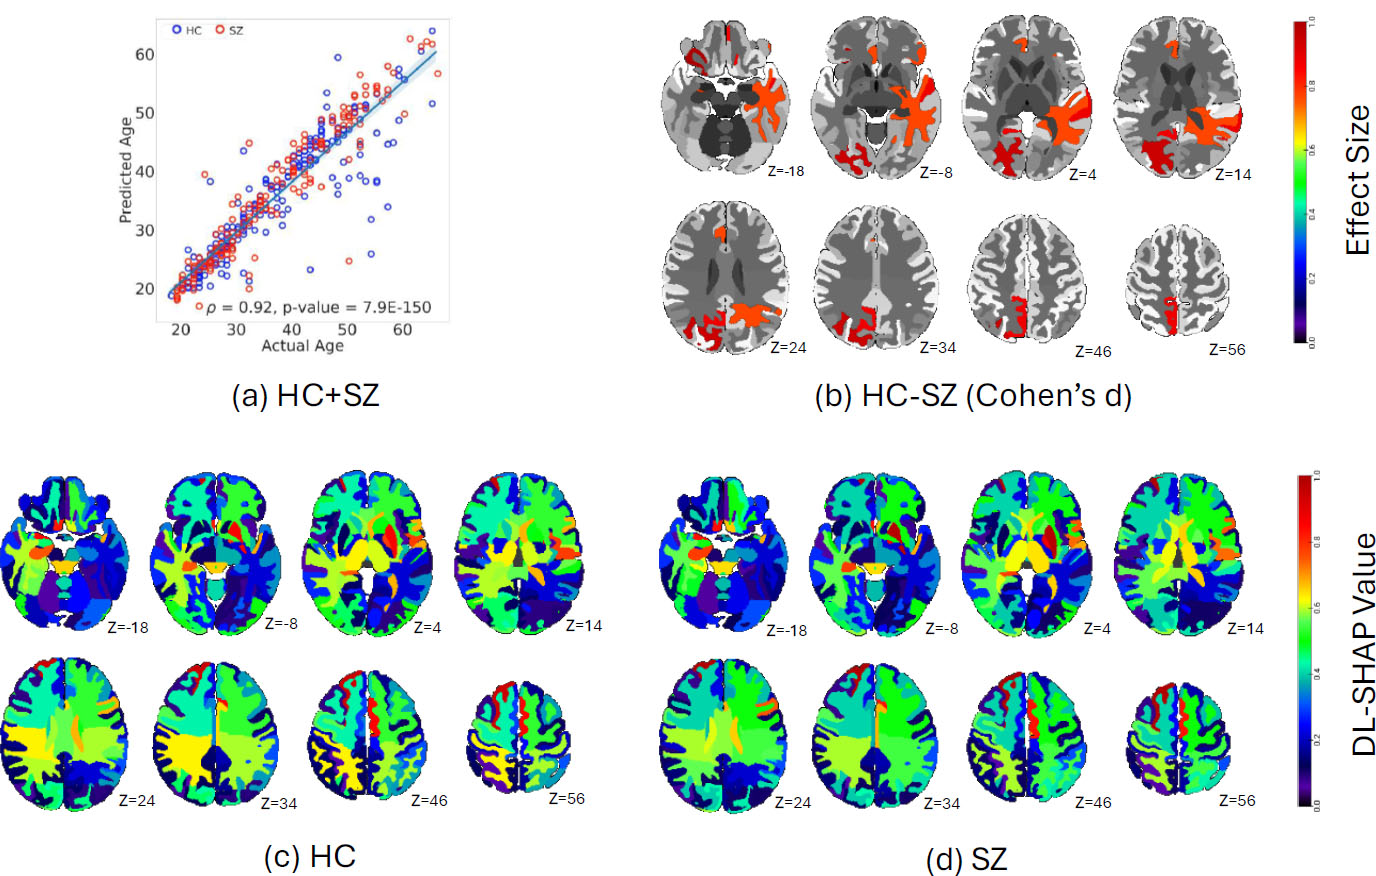
Brain age prediction via the DL-SHAP model. (a) The correlation between actual and predicted brain age. (b) Cohen’s d analysis (absolute value) comparing HC and SZ brains. We compared each ROI in HC and SZ brains by calculating Cohen’s d using the SHAP value of each participant in two populations, and the absolute effect size is plotted. The color bar represents the absolute value of effect size. (c) The significant brain regions in the HC group. The average absolute SHAP values of each brain region in the HC population are plotted. The color bar represents the average absolute SHAP value. (d) The significant brain regions in the SZ group. The average absolute SHAP values of each brain region in the HC population are plotted. The color bar represents the average absolute SHAP value.
4. DISCUSSION
This study systematically investigated the hierarchy of multivariate brain regions associated with SZ mechanisms, particularly HC/SZ classification, sex classification, and brain age prediction. We found that the DL model outperformed the rest of the ML models in all classification- and regression-based predictions, and this finding was broadly consistent with previous studies [56, 57, 65-68] suggesting the superior performance of the DL model for classification and brain age predictions in various disorders, including SZ. This superior performance of the DL model might be due to being more complex compared to the rest of the ML models, such that it can capture the complex brain volumetric changes associated with HC/SZ, gender, and age. Such superior performance of DL was not limited to just SZ-related tasks, but it was found to be generalizable to different image modalities and diseases [69-73], suggesting the important role DL could play in future medical science development. The DL model proved to be a reliable model with decent performance for investigating the multivariate relationships between regional brain biomarkers and different aspects of SZ. We then integrated the outperforming DL model with SHAP, collectively referred to as DL-SHAP. The integrated DL-SHAP explainable AI approach uncovered the individuals with SZ to have anatomical changes, particularly in the left pallidum, left posterior insula, left hippocampus, and left putamen regions, and such brain alterations associated with SZ showed a different pattern in female and male patients.
We found important brain regions in terms of DL-SHAP regional features for HC and SZ classification tasks, suggesting that these regions undergo structural changes with the development of SZ. The identified key brain regions have been found to largely overlap with existing literature [74-79]. For example, subcortical structural abnormalities in SZ have been previously studied and the left pallidum and left putamen volumetric increases have been reported in SZ [76]. Our results have shown larger pallidum and putamen to be associated with a higher likelihood of being an SZ patient. The putamen alterations might contribute to the cognitive symptoms of SZ, such as auditory verbal hallucinations and cognitive dysfunction [80, 81]. The pallidum alterations might be related to the negative symptoms of SZ, given its role in reward and motivation [82]. The development of therapeutic treatments could consider slowing down or reverting the changes associated with those regions, which might reduce the SZ-related symptoms. Moreover, hippocampus and insula abnormalities have also been reported in SZ [77, 78]. Our results showed smaller insula and hippocampus to be associated with a higher likelihood of being an SZ patient. The broad agreement between our findings and the existing literature supports the validity of our results, but we innovatively identified the hierarchy of multivariate regions by considering their interactions using our novel DL-SHAP method for SZ vs. HC classification.
Previous studies have shown the susceptibility of males and females to SZ to be different [12, 45, 46]. We have extended these findings by examining sex differences in a fine-grained and multivariate regional manner. A general consensus in the field is that SZ is associated with reduced frontal and temporal volumes in males than females [46]. We identified the left inferior temporal gyrus and right posterior orbital gyrus to be important for sex classification in both male and female patients. In addition, similar to previous studies [83], we also identified the left posterior cingulate gyrus to be an important region for sex classification. Finally, ventricles and corpus callosum were shown to be different between male and female SZ patients [46]. In our study, they were identified as important regions for female SZ patients, but not as important for male SZ patients. While previous studies have shown that certain brain regions are affected differently in males and females with SZ, our study advanced this understanding by demonstrating that the importance of the same brain regions for sex classification varies between males and females, and that different brain regions contribute to sex classification in male and female SZ patients. These results and existing literature collectively suggest the complex interplay between sex and SZ, and such complex neurobiological regional patterns could be innovatively identified using our explainable AI approach in a multivariate way. The sex difference in SZ could arise from a combination of biological and environmental factors. For example, the hormonal difference, particularly the estrogen level in women, could play a role in sex differences in SZ [45]. In addition, environmental factors could also play a big role, as the cultural and social expectations are different for males and females, which could also shape brain structure development and alterations [84].
Finally, for brain age prediction, our findings regarding significant brain regions also overlapped with the existing literature. For instance, prior reports [47, 85] suggest that SZ has a strong impact on the aging process in the right superior frontal gyrus and putamen. While an increase in the volume of the entorhinal area was shown to be associated with SZ [86], it is new that our study explicitly demonstrated its aging process to be closely related to SZ. These findings and existing literature taken together suggested the impact of aging in HC and SZ processes. Brain age predictions could be used as a biomarker for SZ diagnosis. A study [15] showed SZ patients to deviate from the normal aging trajectory, as the predicted age was much higher than the actual chronological age. In reality, a quick computation of brain age and its deviation from the chronological age could be used as a risk factor for SZ.
One limitation of our study is that there are different subtypes of SZ [23, 87-91], but we could not investigate multivariate relationships between different brain regions and different subtypes due to the limitation of sample size. Future studies may consider employing a larger dataset, grouping participants by their SZ subtypes, and investigating the multivariate relationships between regional brain biomarkers and different SZ subtypes. Another limitation of our study was associated with the dataset. We observed that although significant efforts have been made to increase dataset sizes, an imbalance in the sex ratio persists. Given the sex difference in SZ, it would be important to consider including more female participants in the data collection plan in the future. Another limitation involved the unavailability of clinical variables, such as SZ symptoms, duration of illness, and medication status, in this publicly available neuroimaging dataset. Thus, future studies should focus on examining those clinical measures in the context of the proposed explainable AI approaches and neuroimaging data. Also, this study focused on a single-session visit, not providing insights into how the multivariate relationships between brain structural alterations and SZ change with disease progression.
CONCLUSION
In conclusion, in this work, we utilized a range of ML/DL models to systematically investigate SZ neurobiological mechanisms, focusing on SZ classification, sex differences, and brain age using MRI and demographic data. The DL model outperformed other models in all classification and regression tasks. Our integrated novel DL-SHAP method further provided valuable insights into the dominant multivariate regional brain hubs associated with SZ diagnosis, sex-based differences, and brain age prediction. The findings collectively contributed to a deeper understanding of the underlying neurobiological mechanisms of SZ, offering new perspectives that could aid in diagnostic, prognostic, and therapeutic strategies.
Future studies should consider extending our results and evaluating how such multivariate relationships between brain alterations and SZ progression change over time and vary with different SZ subtypes, as well as studying clinical measures. Building a dataset with a more balanced sex ratio could also be an important goal for the entire field. This study is expected to serve as the foundation for extending these explainable AI approaches to other neuroimaging modalities, like fMRI, PET, EEG, etc., to achieve a multifactorial holistic understanding of SZ and other related disorders.
AUTHORS’ CONTRIBUTIONS
It is hereby acknowledged that all authors have accepted responsibility for the manuscript's content and consented to its submission. They have meticulously reviewed all results and unanimously approved the final version of the manuscript.
LIST OF ABBREVIATIONS
| SZ | = Schizophrenia |
| AI | = Artificial Intelligence |
| SVC | = Support Vector Classifier |
| KNN | = K-nearest Neighbor |
| DL | = Deep Learning Neural Network |
| LR | = Lasso Regression |
| RR | = Ridge Regression |
| SVR | = Support Vector Regression |
| SHAP | = Shapley Additive Explanations |
| HC | = Healthy Controls |
| ML | = Machine Learning |
| MRI | = Magnetic Resonance Imaging |
| MUSE | = Multi-atlas region segmentation utilizing ensembles of registration algorithms and parameters and locally optimal atlas selection |
| ROIs | = Regions of Interest |
| RBF | = Radial Basis Function |
| ReLU | = Rectified Linear Unit |
| CV | = Cross-validation |
| BCE | = Binary Cross Entropy |
| MAE | = Mean Absolute Error |
| COBRE | = Center for Biomedical Research Excellence |
AVAILABILITY OF DATA AND MATERIALS
All data generated or analyzed during this study are included in this published article.
FUNDING
GBC is supported by the Mallinckrodt Institute of Radiology from Washington University in St. Louis as well as by the National Institutes of Health K01AG083230.
SchizConnect data collection and sharing for this project was funded by NIMH cooperative agreement 1U01 MH097435. COBRE data were downloaded from the Collaborative Informatics and Neuroimaging Suite Data Exchange tool (COINS; http://coins.mrn.org/dx) and data collection was performed at the Mind Research Network and funded by a Center of Biomedical Research Excellence (COBRE) grant 5P20RR021938/P20GM103472 from the NIH to Dr. Vince Calhoun. The fBIRN data used for this study were downloaded from the Function BIRN Data Repository (http://fbirnbdr.birncommunity.org:8080/BDR/), supported by grants to the Function BIRN (U24-RR021992) Testbed funded by the National Center for Research Resources at the National Institutes of Health, U.S.A. NMorhCH data used in the preparation of this article were obtained from the Neuromorphometry by Computer Algorithm Chicago (NMorphCH) dataset (http://nunda.northwestern.edu/nunda/data/projects/NMorphCH). As such, the investigators within NMorphCH contributed to the design and implementation of NMorphCH and/or provided data, but they did not participate in the analysis or writing of this report. Moreover, data collection and sharing for this project was funded by NIMH grant R01 MH056584.
CONFLICT OF INTEREST
Dr. Ganesh B Chand is the Editor In Chief of the journal The Open Neuroimaging Journal.
ACKNOWLEDGEMENTS
Declared none.